CODEerts
Project app for Odoo
Project Flow Analytics & Agile Reports
Agile and flow reporting for Odoo Project with average time in each stage (cycle time), a cumulative flow pivot, and a sprint burndown chart built from a daily snapshot, all as native graph, pivot and list views you can filter and group.
Overview
Project Flow Analytics & Agile Reports.
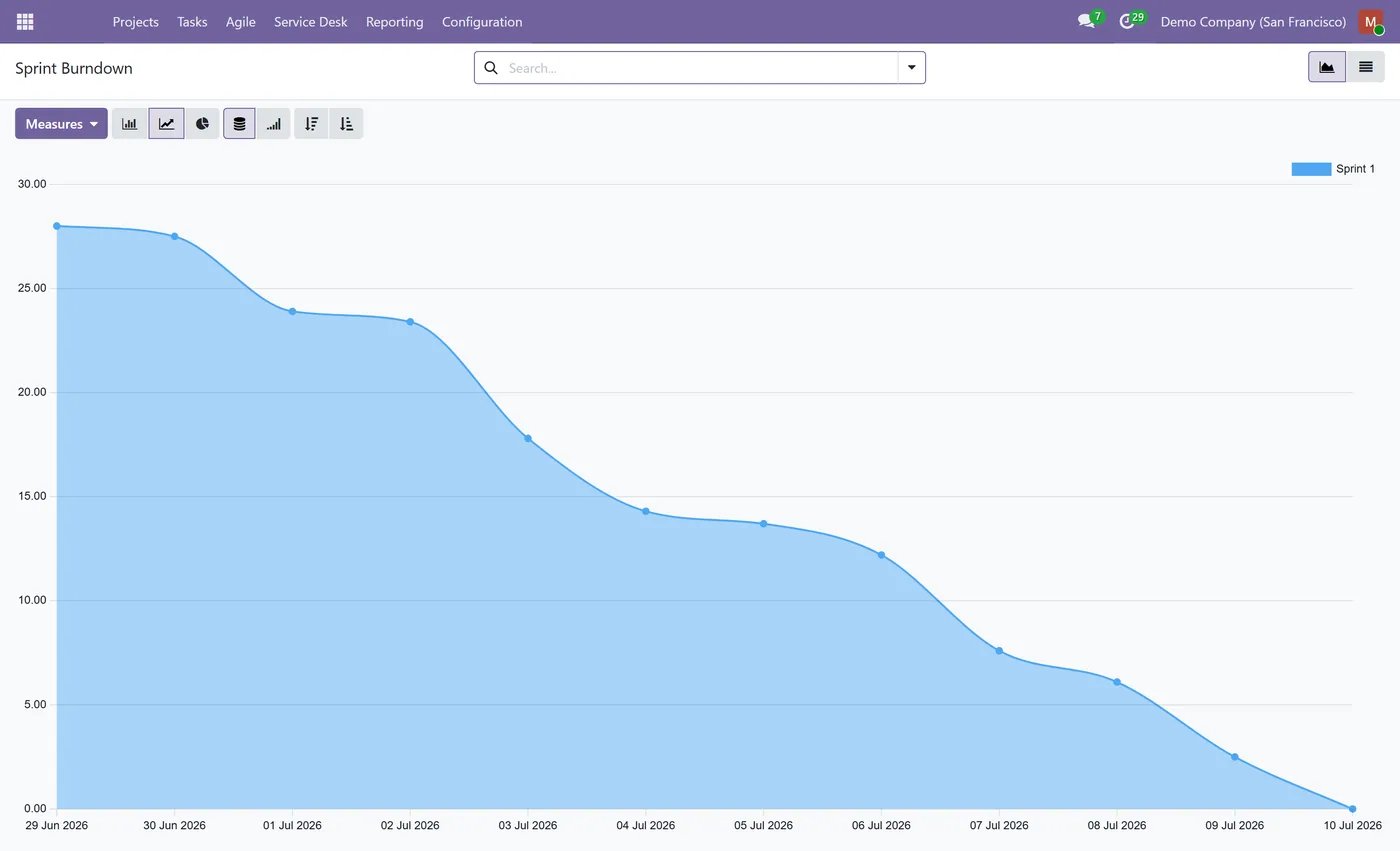
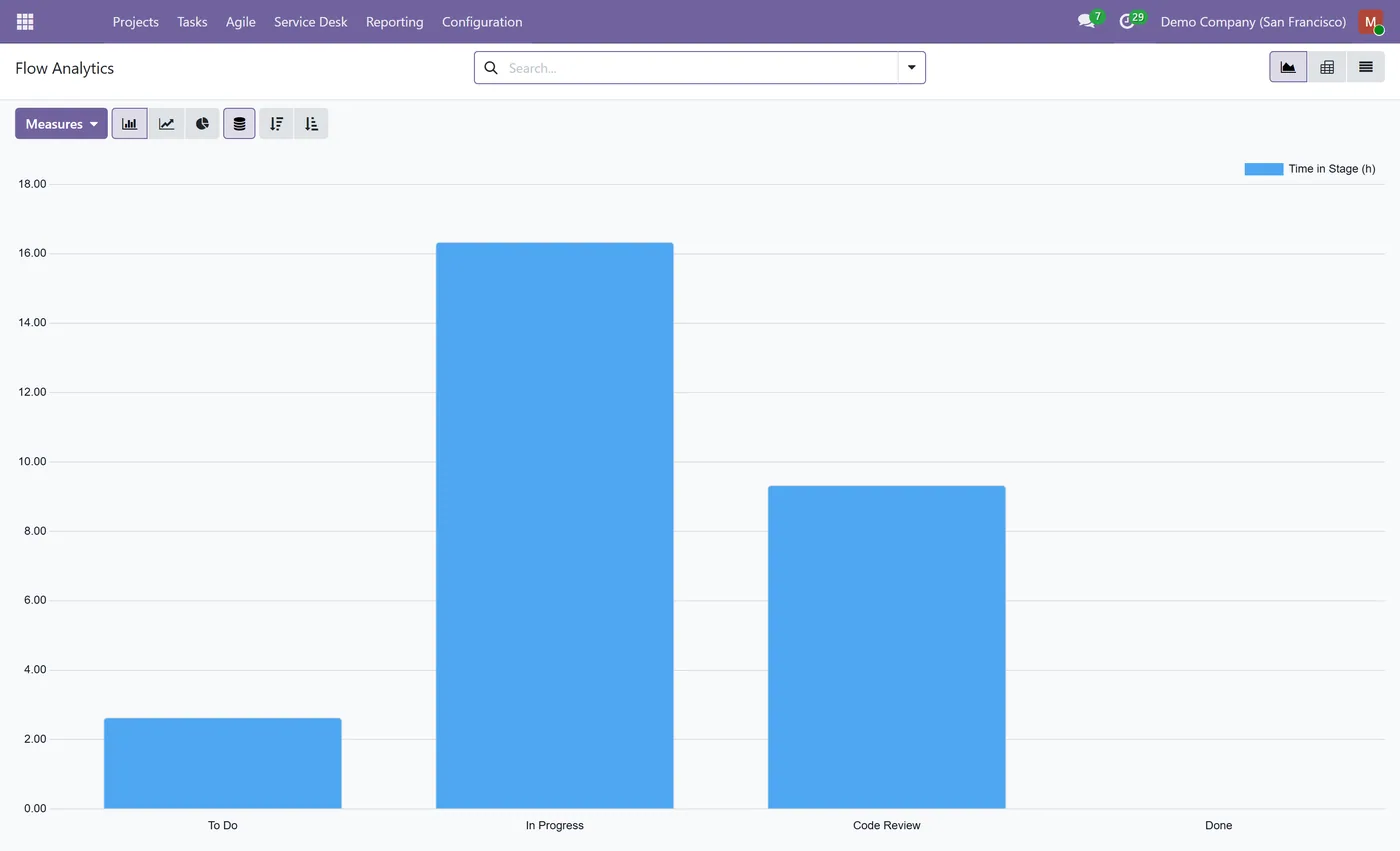
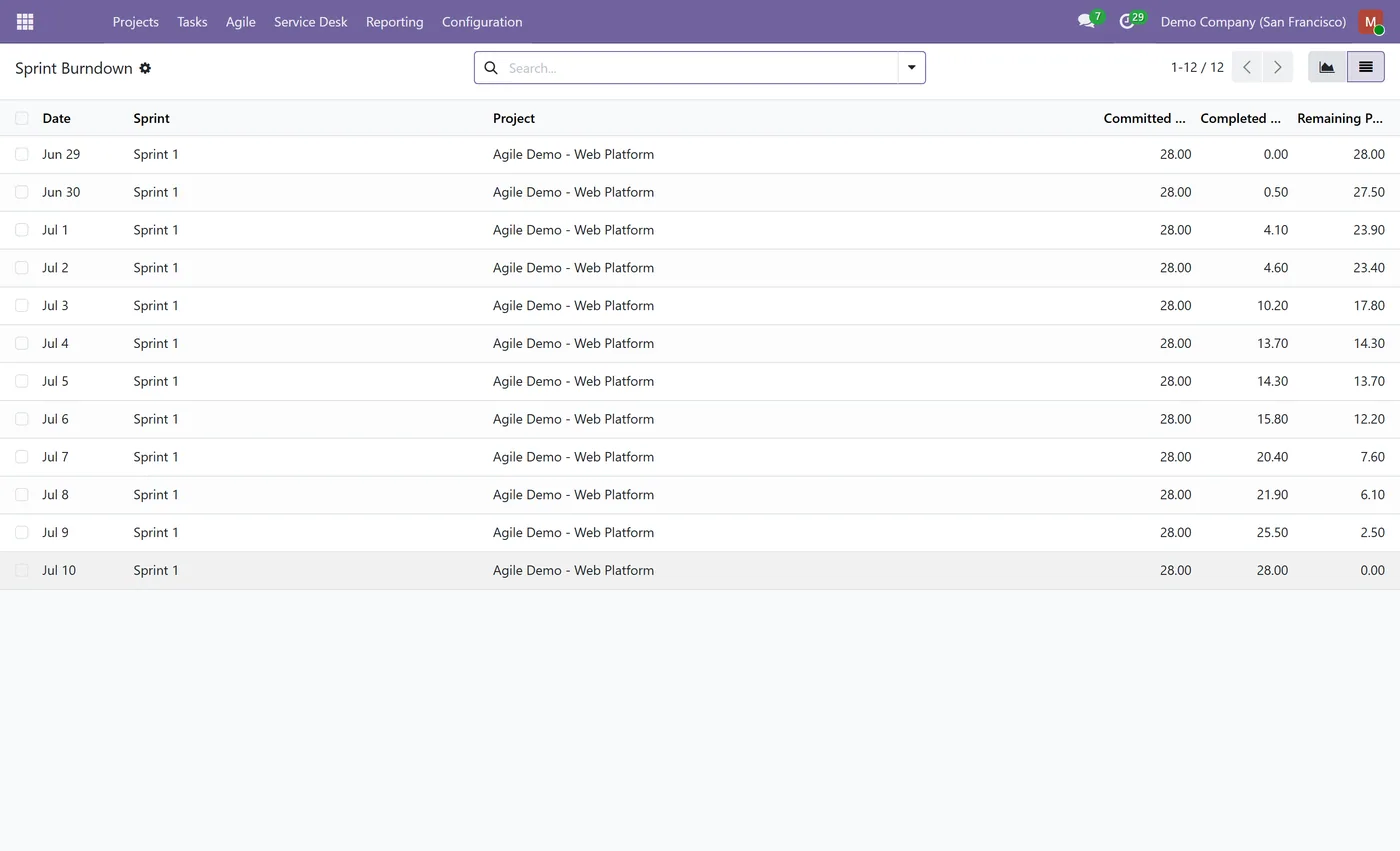
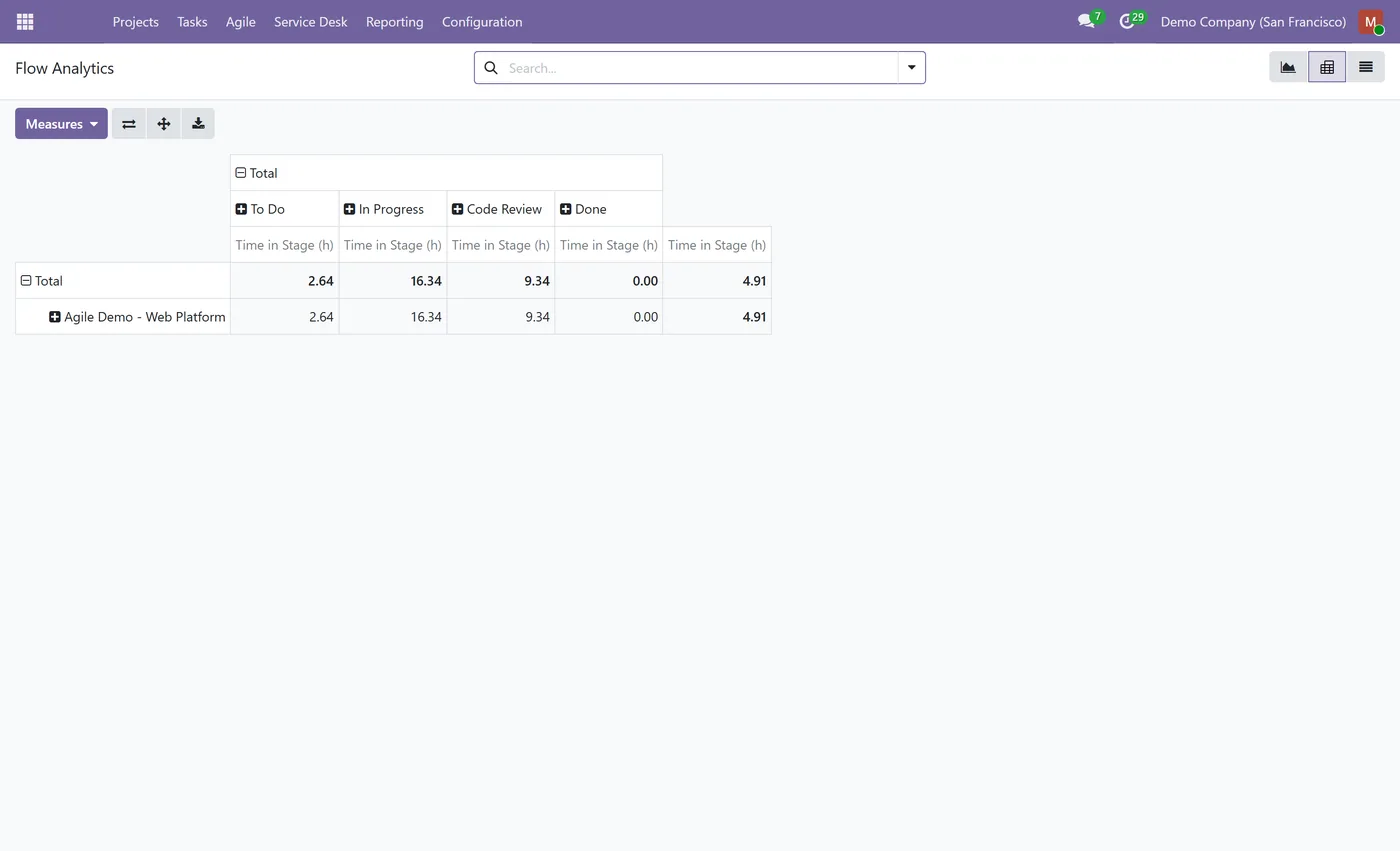
Project Flow Analytics & Agile Reports adds the metrics agile teams live by to Odoo Project. It logs every time a task enters and leaves a stage, so you get the average time in each stage (cycle time) as a graph and a cumulative flow pivot by project and stage. A daily snapshot of every active sprint builds a sprint burndown chart that shows remaining story points falling over the sprint. All reports are native Odoo graph, pivot and list views, so you can filter, group and drill down with the standard tools and export to spreadsheet. It reads your task and stage history and needs no Enterprise edition; the sprint burndown fills in automatically when the Agile module is installed.
New to Odoo Project? Read our practical guide to how it works
How it works
Built around what you actually do.
Every screen below is the module running in Odoo, not a mockup.
01
Stage log that records when each task enters and leaves a stage
- Average time in stage (cycle time) as a graph you can group and filter
- Cumulative flow pivot by project and stage
02
Sprint burndown chart from a daily snapshot of remaining story points
- Native graph, pivot and list views, filterable and exportable
- Reports live under the Project Reporting menu
03
Reads task and stage history, no Enterprise dependency
What it does
Project Flow Analytics adds the agile metrics teams actually track to Odoo Project: how long work sits in each stage, how tasks flow across the board, and whether a sprint is burning down on schedule, all as native, filterable Odoo reports.
Who it's for
Agile teams, delivery managers and PMOs who want cycle time, cumulative flow and burndown reporting on Odoo Project without exporting data to another tool.
Questions
About Project Flow Analytics & Agile Reports.
How do I measure cycle time in Odoo Project?
The module logs every stage change on a task, then computes the time spent in each stage. A Flow Analytics report shows the average time in stage as a graph and a pivot, so you can see where work slows down.
Can I build a cumulative flow diagram in Odoo?
Yes. The stage log feeds a pivot by project and stage, which gives you a cumulative-flow view of how many tasks sit in each stage over time, using the standard Odoo pivot tools.
How is the sprint burndown built?
A daily scheduled job snapshots each active sprint's remaining story points. The burndown chart plots those daily points so you can see whether the sprint is on track. It fills in automatically when the Agile module is installed.
Do I need the Agile module for this to work?
The cycle-time and cumulative-flow reports work on any Odoo Project. The sprint burndown needs sprints and story points, which come from the companion Agile module; without it the other reports still work.
Which Odoo versions and editions are supported?
Use the version selector at the top of this page to pick your Odoo release. The module builds on the standard Project app and runs on Community as well as Enterprise.
On the Odoo Store
Get Project Flow Analytics & Agile Reports on the Odoo Store.
Pick your Odoo version and install it in a click, with free updates and real support behind it.
Get it on the Odoo StoreReady to make Odoo work the way your business does?
Book a free call CODEerts
CODEerts is a team of certified Odoo partners and full-stack engineers. We implement, customise and support Odoo ERP, then build the software around it.